

Market recap · September 2026
The DFW
market report.
Jim’s monthly perspective, followed by the county and city reports. Read all six pages below.
Figures and rate references are dated to the report. They are not live updates.
Page 1 of 6
DFW overview
Text version of page 1
Text follows the original page’s reading order. For the chart columns and layout, use the page image or PDF.
More Room to Negotiate
September 2026 DFW Market Update | October 9, 2026
Hi folks, it's Jim with your September DFW market update.
Before we get into the September update, please take a look at my recently redesigned website,
jimboykinrealestate.com. I’d like to hear your thoughts on how it works for you.
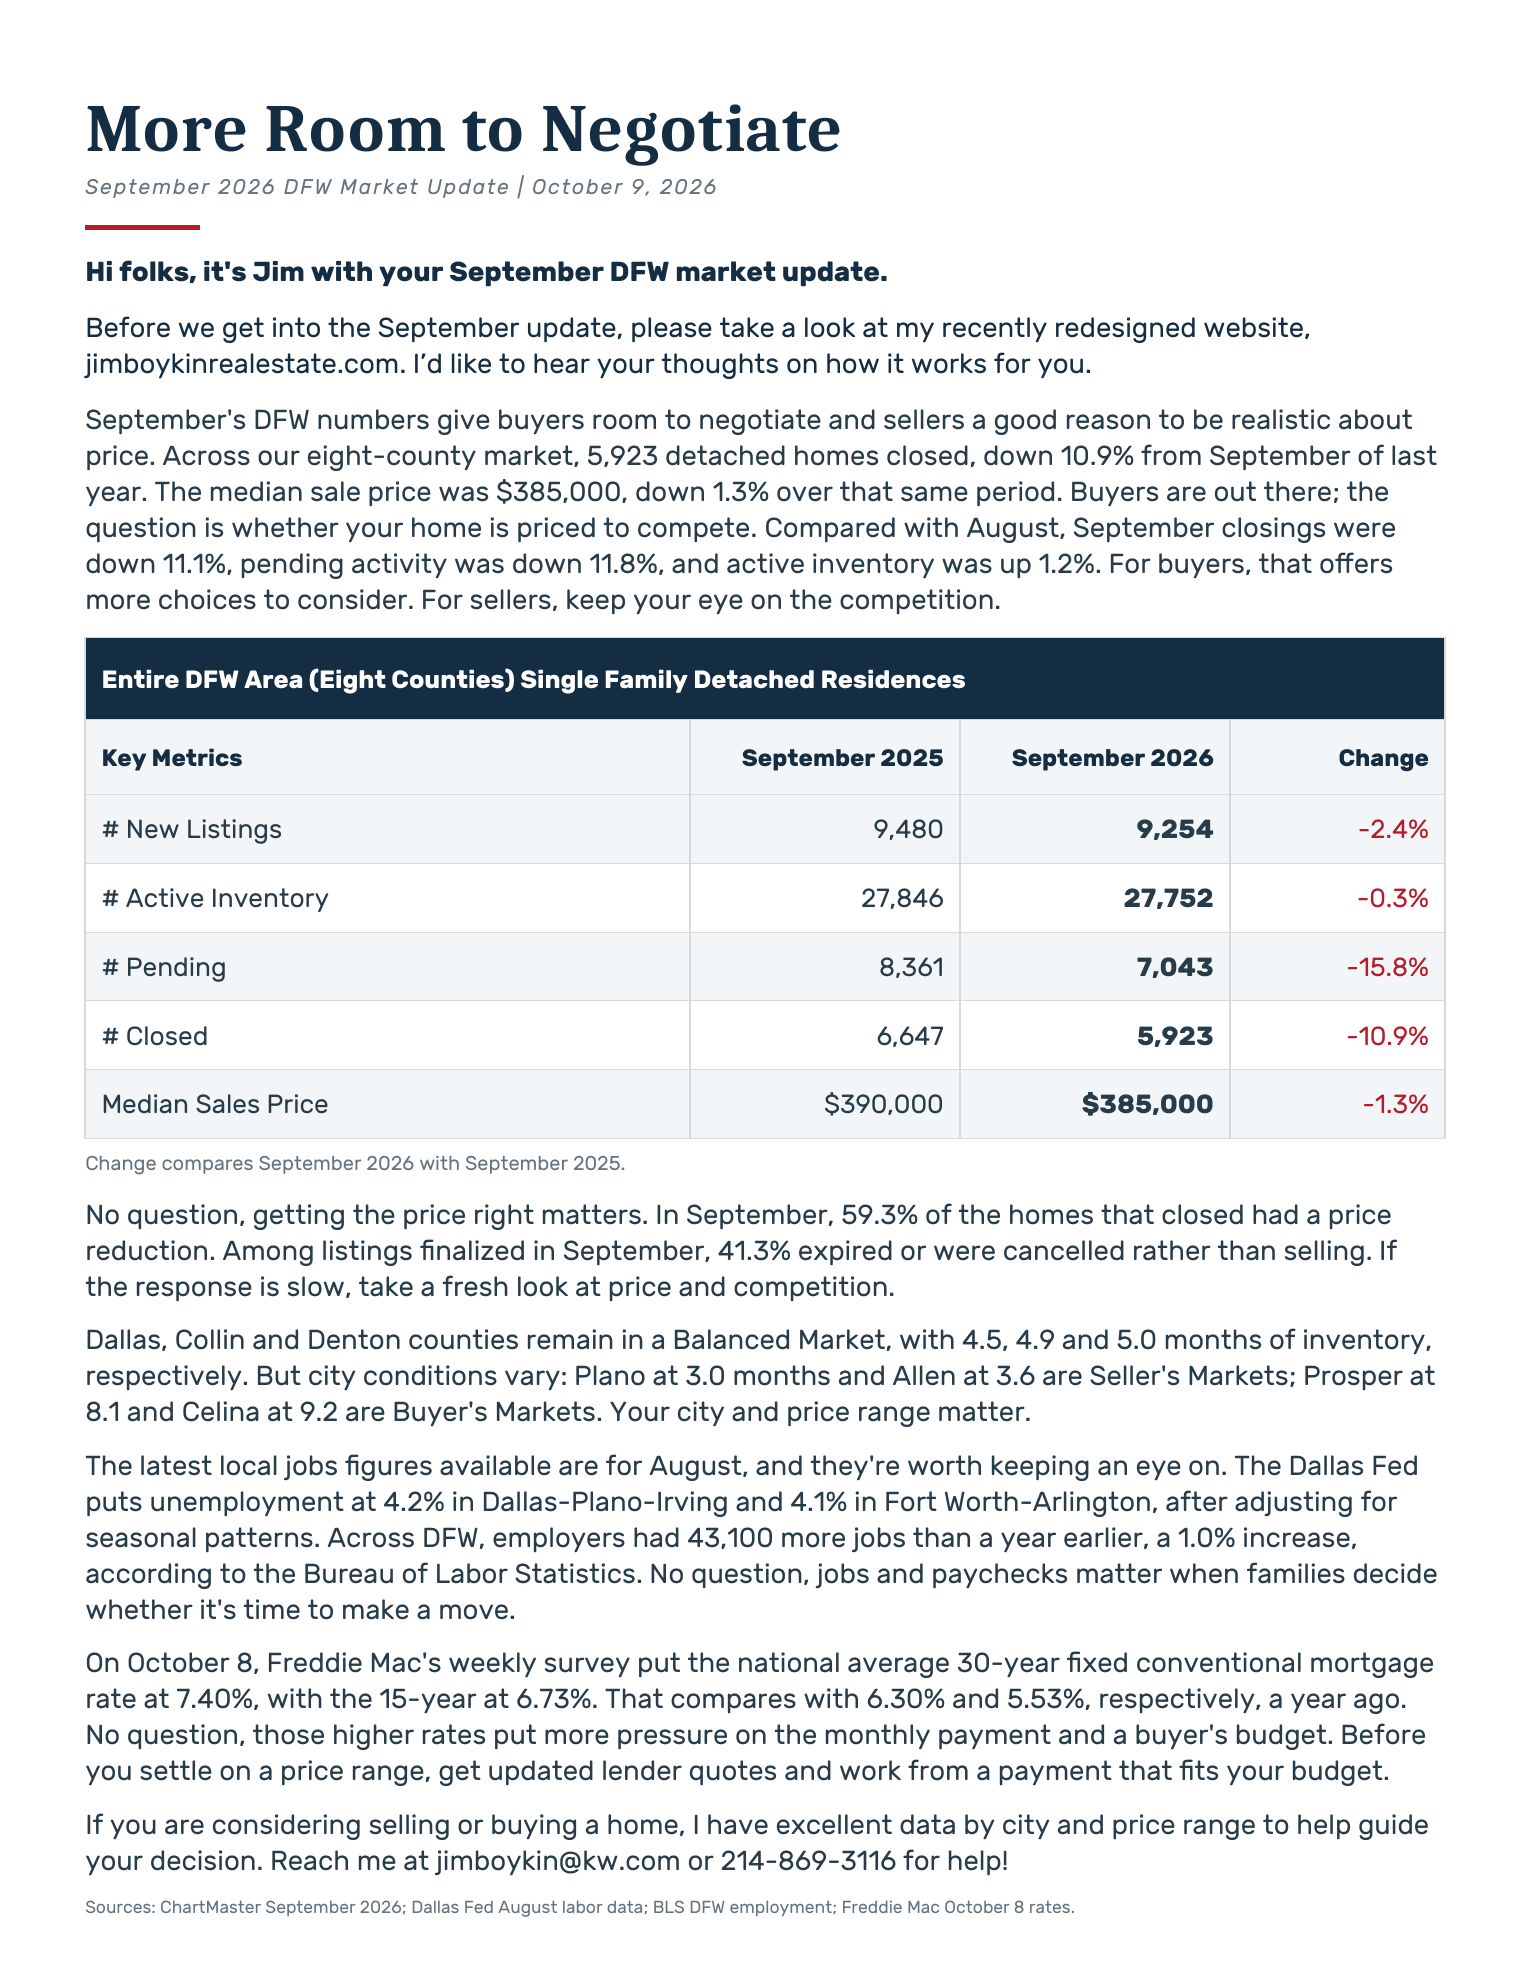
September's DFW numbers give buyers room to negotiate and sellers a good reason to be realistic about
price. Across our eight-county market, 5,923 detached homes closed, down 10.9% from September of last
year. The median sale price was $385,000, down 1.3% over that same period. Buyers are out there; the
question is whether your home is priced to compete. Compared with August, September closings were
down 11.1%, pending activity was down 11.8%, and active inventory was up 1.2%. For buyers, that offers
more choices to consider. For sellers, keep your eye on the competition.
Entire DFW Area (Eight Counties) Single Family Detached Residences
Key Metrics September 2025 September 2026 Change
# New Listings 9,480 9,254 -2.4%
# Active Inventory 27,846 27,752 -0.3%
# Pending 8,361 7,043 -15.8%
# Closed 6,647 5,923 -10.9%
Median Sales Price $390,000 $385,000 -1.3%
Change compares September 2026 with September 2025.
No question, getting the price right matters. In September, 59.3% of the homes that closed had a price
reduction. Among listings finalized in September, 41.3% expired or were cancelled rather than selling. If
the response is slow, take a fresh look at price and competition.
Dallas, Collin and Denton counties remain in a Balanced Market, with 4.5, 4.9 and 5.0 months of inventory,
respectively. But city conditions vary: Plano at 3.0 months and Allen at 3.6 are Seller's Markets; Prosper at
8.1 and Celina at 9.2 are Buyer's Markets. Your city and price range matter.
The latest local jobs figures available are for August, and they're worth keeping an eye on. The Dallas Fed
puts unemployment at 4.2% in Dallas-Plano-Irving and 4.1% in Fort Worth-Arlington, after adjusting for
seasonal patterns. Across DFW, employers had 43,100 more jobs than a year earlier, a 1.0% increase,
according to the Bureau of Labor Statistics. No question, jobs and paychecks matter when families decide
whether it's time to make a move.
On October 8, Freddie Mac's weekly survey put the national average 30-year fixed conventional mortgage
rate at 7.40%, with the 15-year at 6.73%. That compares with 6.30% and 5.53%, respectively, a year ago.
No question, those higher rates put more pressure on the monthly payment and a buyer's budget. Before
you settle on a price range, get updated lender quotes and work from a payment that fits your budget.
If you are considering selling or buying a home, I have excellent data by city and price range to help guide
your decision. Reach me at jimboykin@kw.com or 214-869-3116 for help!
Sources: ChartMaster September 2026; Dallas Fed August labor data; BLS DFW employment; Freddie Mac October 8 rates.
Page 2 of 6
Dallas, Collin & Denton counties
Text version of page 2
Text follows the original page’s reading order. For the chart columns and layout, use the page image or PDF.
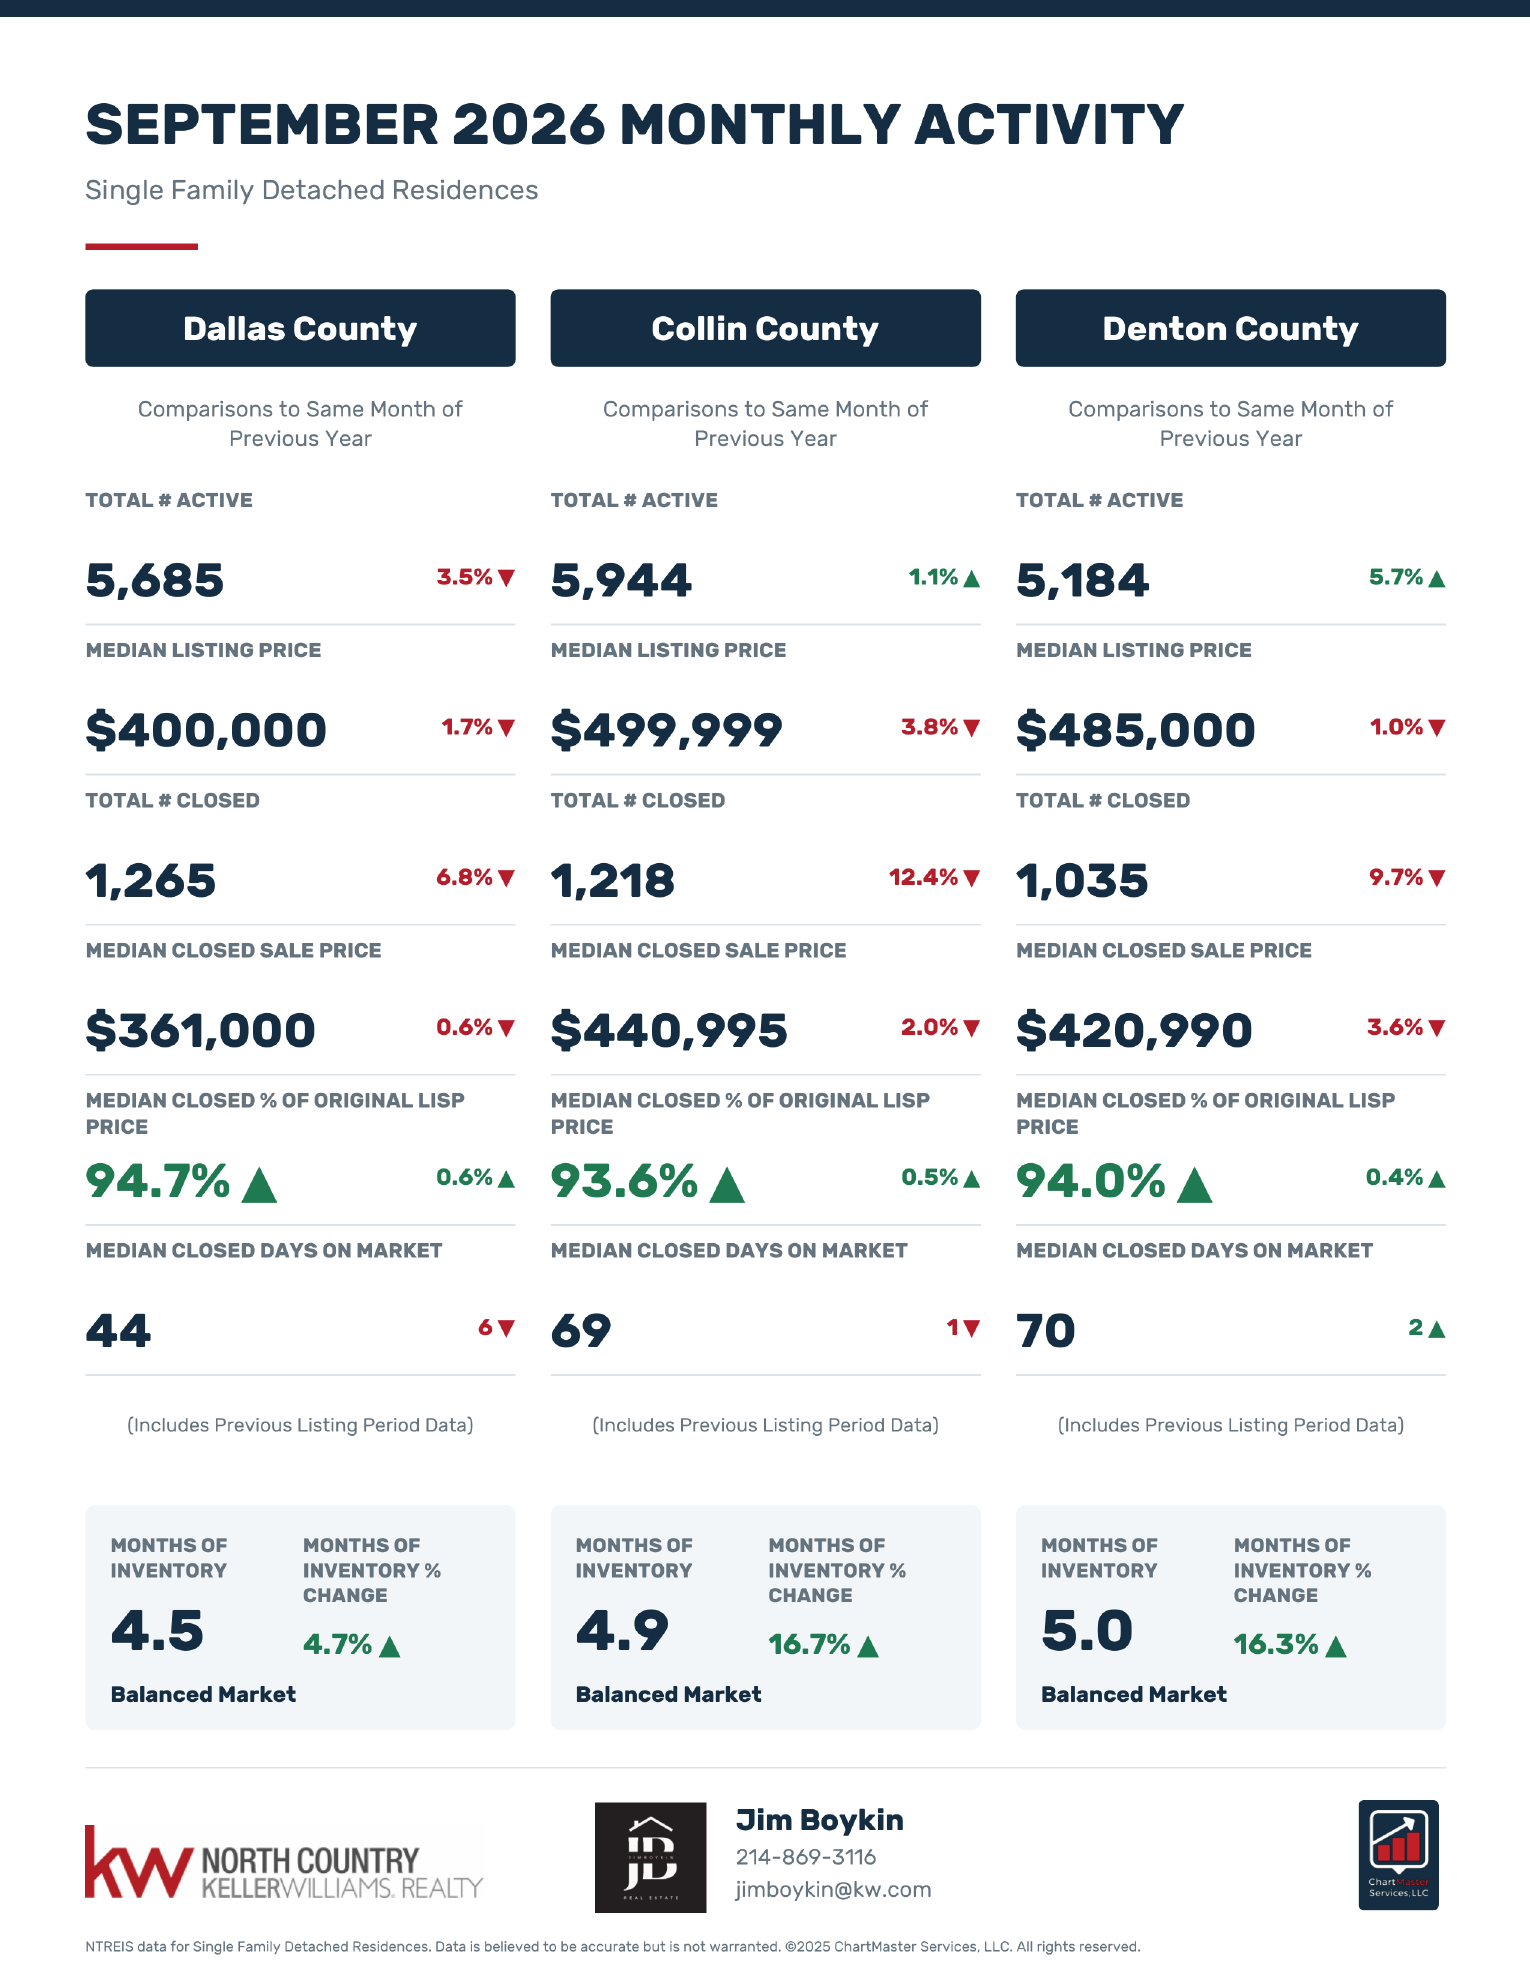
SEPTEMBER 2026 MONTHLY ACTIVITY
Single Family Detached Residences
Dallas County
 Comparisons to Same Month of
 Previous Year
TOTAL # ACTIVE
5,685
 3.5% ▼
MEDIAN LISTING PRICE
$400,000
 1.7% ▼
TOTAL # CLOSED
1,265
 6.8% ▼
MEDIAN CLOSED SALE PRICE
$361,000
 0.6% ▼
MEDIAN CLOSED % OF ORIGINAL LISP
PRICE
94.7% ▲
 0.6% ▲
MEDIAN CLOSED DAYS ON MARKET
44
 6 ▼
 (Includes Previous Listing Period Data)
MONTHS OF
INVENTORY
MONTHS OF
INVENTORY %
CHANGE
4.5
4.7% ▲
Balanced Market
Collin County
 Comparisons to Same Month of
 Previous Year
TOTAL # ACTIVE
5,944
 1.1% ▲
MEDIAN LISTING PRICE
$499,999
 3.8% ▼
TOTAL # CLOSED
1,218
 12.4% ▼
MEDIAN CLOSED SALE PRICE
$440,995
 2.0% ▼
MEDIAN CLOSED % OF ORIGINAL LISP
PRICE
93.6% ▲
 0.5% ▲
MEDIAN CLOSED DAYS ON MARKET
69
 1 ▼
 (Includes Previous Listing Period Data)
MONTHS OF
INVENTORY
MONTHS OF
INVENTORY %
CHANGE
4.9
16.7% ▲
Balanced Market
Denton County
 Comparisons to Same Month of
 Previous Year
TOTAL # ACTIVE
5,184
 5.7% ▲
MEDIAN LISTING PRICE
$485,000
 1.0% ▼
TOTAL # CLOSED
1,035
 9.7% ▼
MEDIAN CLOSED SALE PRICE
$420,990
 3.6% ▼
MEDIAN CLOSED % OF ORIGINAL LISP
PRICE
94.0% ▲
 0.4% ▲
MEDIAN CLOSED DAYS ON MARKET
70
 2 ▲
 (Includes Previous Listing Period Data)
MONTHS OF
INVENTORY
MONTHS OF
INVENTORY %
CHANGE
5.0
16.3% ▲
Balanced Market
Jim Boykin
214-869-3116
jimboykin@kw.com
NTREIS data for Single Family Detached Residences. Data is believed to be accurate but is not warranted. ©2025 ChartMaster Services, LLC. All rights reserved.
Page 3 of 6
Frisco, Prosper & Celina
Text version of page 3
Text follows the original page’s reading order. For the chart columns and layout, use the page image or PDF.
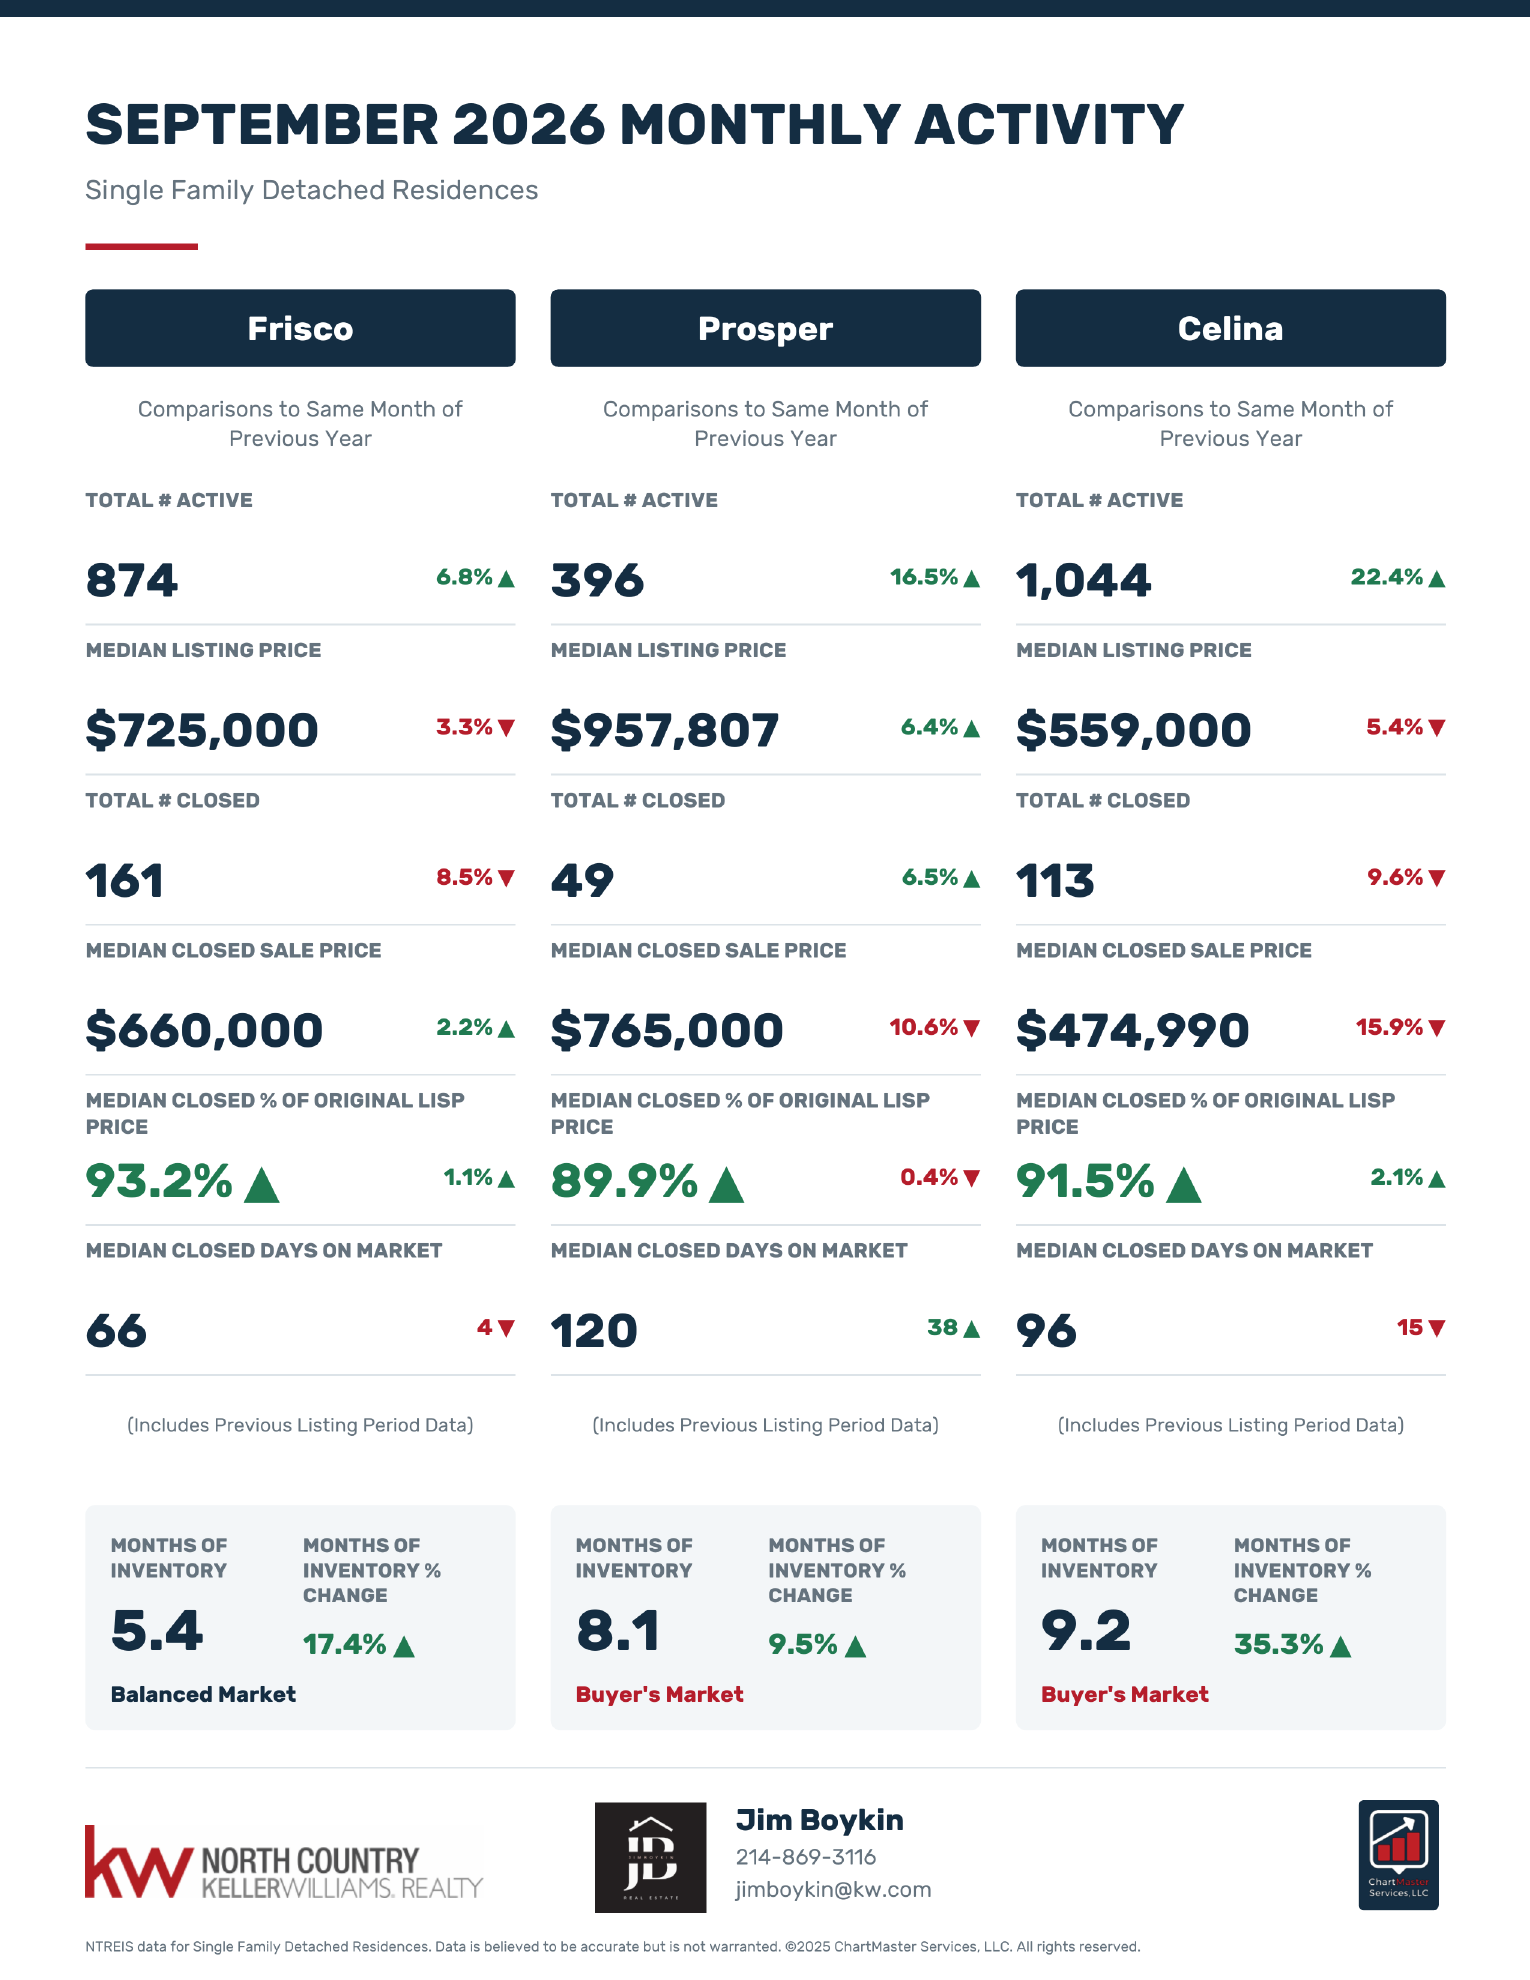
SEPTEMBER 2026 MONTHLY ACTIVITY
Single Family Detached Residences
Frisco
 Comparisons to Same Month of
 Previous Year
TOTAL # ACTIVE
874
 6.8% ▲
MEDIAN LISTING PRICE
$725,000
 3.3% ▼
TOTAL # CLOSED
161
 8.5% ▼
MEDIAN CLOSED SALE PRICE
$660,000
 2.2% ▲
MEDIAN CLOSED % OF ORIGINAL LISP
PRICE
93.2% ▲
 1.1% ▲
MEDIAN CLOSED DAYS ON MARKET
66
 4 ▼
 (Includes Previous Listing Period Data)
MONTHS OF
INVENTORY
MONTHS OF
INVENTORY %
CHANGE
5.4
17.4% ▲
Balanced Market
Prosper
 Comparisons to Same Month of
 Previous Year
TOTAL # ACTIVE
396
 16.5% ▲
MEDIAN LISTING PRICE
$957,807
 6.4% ▲
TOTAL # CLOSED
49
 6.5% ▲
MEDIAN CLOSED SALE PRICE
$765,000
 10.6% ▼
MEDIAN CLOSED % OF ORIGINAL LISP
PRICE
89.9% ▲
 0.4% ▼
MEDIAN CLOSED DAYS ON MARKET
120
 38 ▲
 (Includes Previous Listing Period Data)
MONTHS OF
INVENTORY
MONTHS OF
INVENTORY %
CHANGE
8.1
9.5% ▲
Buyer's Market
Celina
 Comparisons to Same Month of
 Previous Year
TOTAL # ACTIVE
1,044
 22.4% ▲
MEDIAN LISTING PRICE
$559,000
 5.4% ▼
TOTAL # CLOSED
113
 9.6% ▼
MEDIAN CLOSED SALE PRICE
$474,990
 15.9% ▼
MEDIAN CLOSED % OF ORIGINAL LISP
PRICE
91.5% ▲
 2.1% ▲
MEDIAN CLOSED DAYS ON MARKET
96
 15 ▼
 (Includes Previous Listing Period Data)
MONTHS OF
INVENTORY
MONTHS OF
INVENTORY %
CHANGE
9.2
35.3% ▲
Buyer's Market
Jim Boykin
214-869-3116
jimboykin@kw.com
NTREIS data for Single Family Detached Residences. Data is believed to be accurate but is not warranted. ©2025 ChartMaster Services, LLC. All rights reserved.
Page 4 of 6
Plano, Allen & McKinney
Text version of page 4
Text follows the original page’s reading order. For the chart columns and layout, use the page image or PDF.
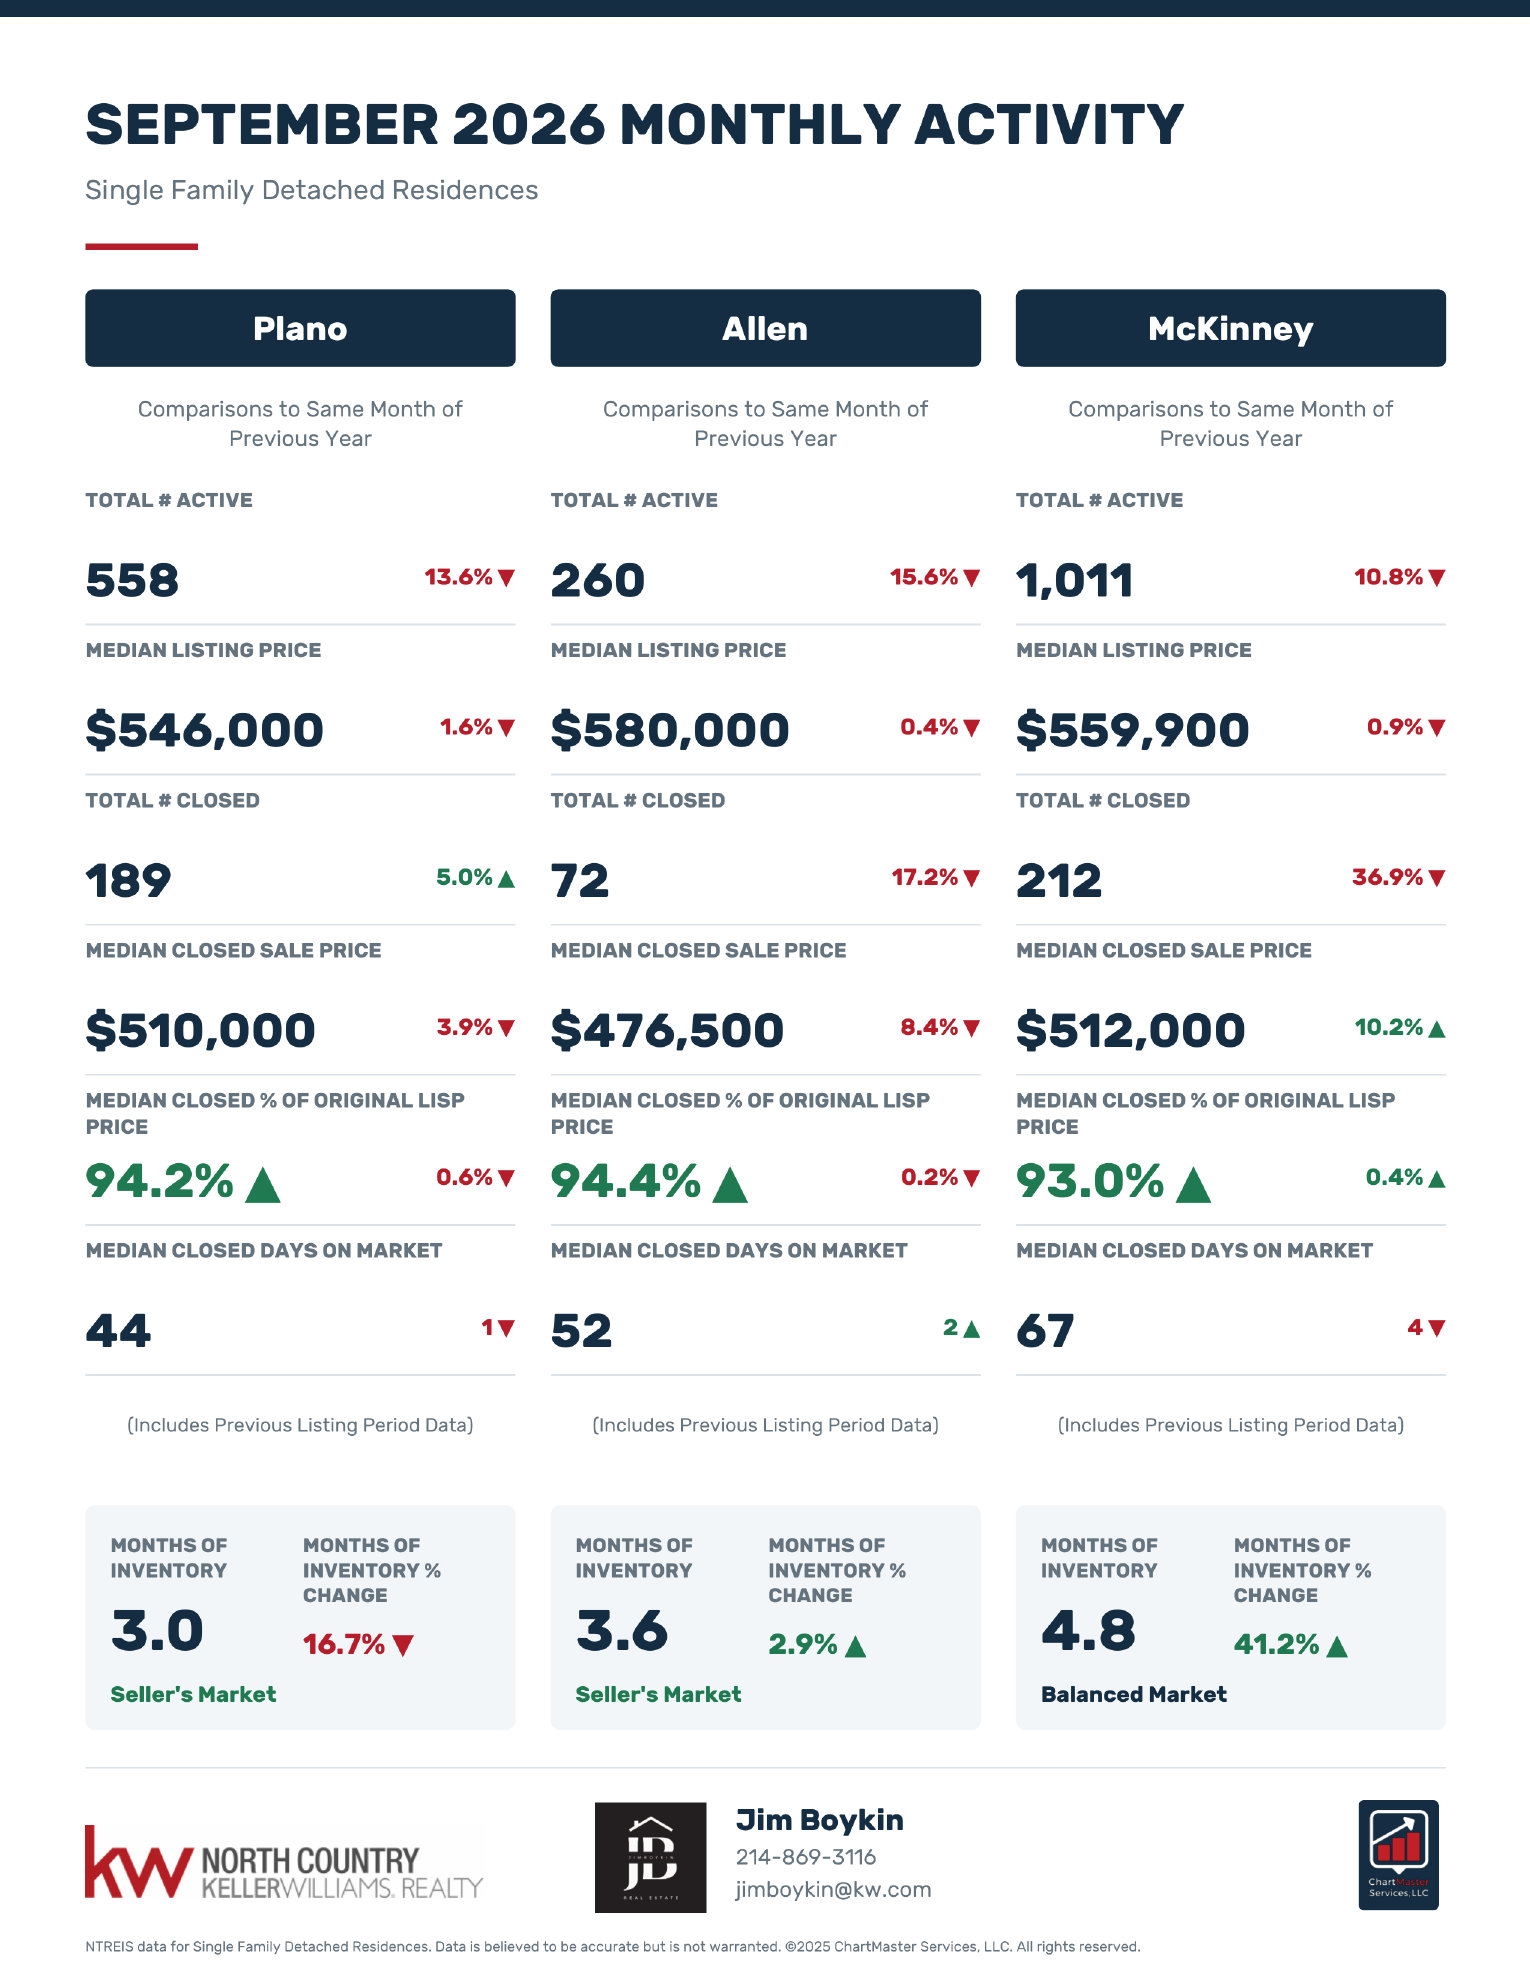
SEPTEMBER 2026 MONTHLY ACTIVITY
Single Family Detached Residences
Plano
 Comparisons to Same Month of
 Previous Year
TOTAL # ACTIVE
558
 13.6% ▼
MEDIAN LISTING PRICE
$546,000
 1.6% ▼
TOTAL # CLOSED
189
 5.0% ▲
MEDIAN CLOSED SALE PRICE
$510,000
 3.9% ▼
MEDIAN CLOSED % OF ORIGINAL LISP
PRICE
94.2% ▲
 0.6% ▼
MEDIAN CLOSED DAYS ON MARKET
44
 1 ▼
 (Includes Previous Listing Period Data)
MONTHS OF
INVENTORY
MONTHS OF
INVENTORY %
CHANGE
3.0
16.7% ▼
Seller's Market
Allen
 Comparisons to Same Month of
 Previous Year
TOTAL # ACTIVE
260
 15.6% ▼
MEDIAN LISTING PRICE
$580,000
 0.4% ▼
TOTAL # CLOSED
72
 17.2% ▼
MEDIAN CLOSED SALE PRICE
$476,500
 8.4% ▼
MEDIAN CLOSED % OF ORIGINAL LISP
PRICE
94.4% ▲
 0.2% ▼
MEDIAN CLOSED DAYS ON MARKET
52
 2 ▲
 (Includes Previous Listing Period Data)
MONTHS OF
INVENTORY
MONTHS OF
INVENTORY %
CHANGE
3.6
2.9% ▲
Seller's Market
McKinney
 Comparisons to Same Month of
 Previous Year
TOTAL # ACTIVE
1,011
 10.8% ▼
MEDIAN LISTING PRICE
$559,900
 0.9% ▼
TOTAL # CLOSED
212
 36.9% ▼
MEDIAN CLOSED SALE PRICE
$512,000
 10.2% ▲
MEDIAN CLOSED % OF ORIGINAL LISP
PRICE
93.0% ▲
 0.4% ▲
MEDIAN CLOSED DAYS ON MARKET
67
 4 ▼
 (Includes Previous Listing Period Data)
MONTHS OF
INVENTORY
MONTHS OF
INVENTORY %
CHANGE
4.8
41.2% ▲
Balanced Market
Jim Boykin
214-869-3116
jimboykin@kw.com
NTREIS data for Single Family Detached Residences. Data is believed to be accurate but is not warranted. ©2025 ChartMaster Services, LLC. All rights reserved.
Page 5 of 6
Denton, Aubrey & Little Elm
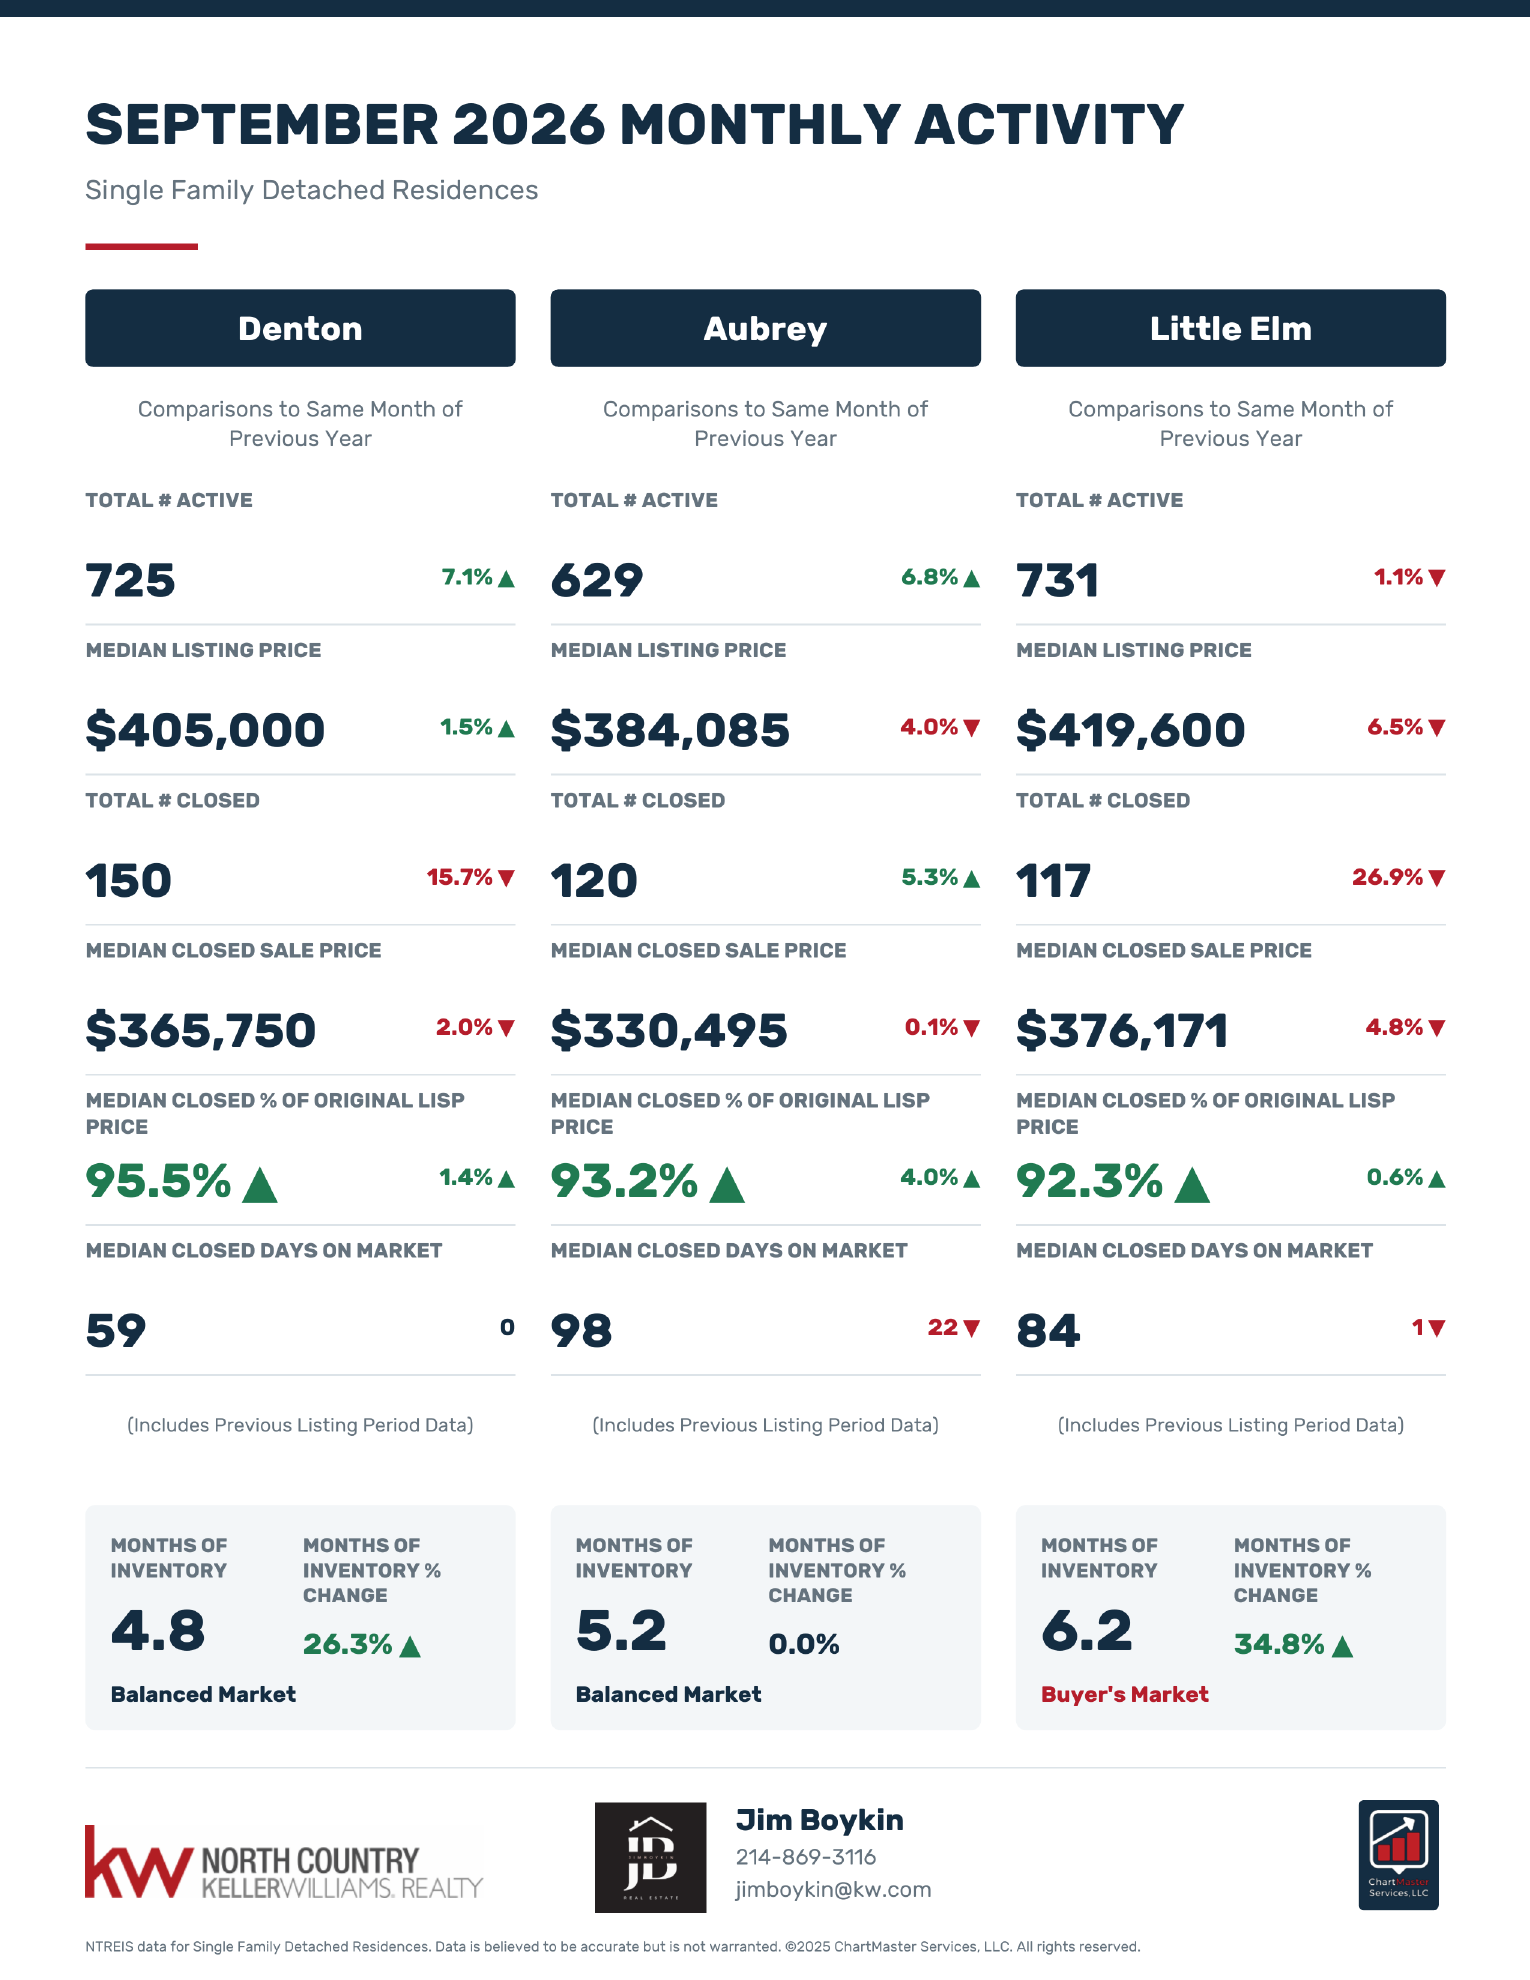
Text version of page 5
Text follows the original page’s reading order. For the chart columns and layout, use the page image or PDF.
SEPTEMBER 2026 MONTHLY ACTIVITY
Single Family Detached Residences
Denton
 Comparisons to Same Month of
 Previous Year
TOTAL # ACTIVE
725
 7.1% ▲
MEDIAN LISTING PRICE
$405,000
 1.5% ▲
TOTAL # CLOSED
150
 15.7% ▼
MEDIAN CLOSED SALE PRICE
$365,750
 2.0% ▼
MEDIAN CLOSED % OF ORIGINAL LISP
PRICE
95.5% ▲
 1.4% ▲
MEDIAN CLOSED DAYS ON MARKET
59
 0
 (Includes Previous Listing Period Data)
MONTHS OF
INVENTORY
MONTHS OF
INVENTORY %
CHANGE
4.8
26.3% ▲
Balanced Market
Aubrey
 Comparisons to Same Month of
 Previous Year
TOTAL # ACTIVE
629
 6.8% ▲
MEDIAN LISTING PRICE
$384,085
 4.0% ▼
TOTAL # CLOSED
120
 5.3% ▲
MEDIAN CLOSED SALE PRICE
$330,495
 0.1% ▼
MEDIAN CLOSED % OF ORIGINAL LISP
PRICE
93.2% ▲
 4.0% ▲
MEDIAN CLOSED DAYS ON MARKET
98
 22 ▼
 (Includes Previous Listing Period Data)
MONTHS OF
INVENTORY
MONTHS OF
INVENTORY %
CHANGE
5.2
0.0%
Balanced Market
Little Elm
 Comparisons to Same Month of
 Previous Year
TOTAL # ACTIVE
731
 1.1% ▼
MEDIAN LISTING PRICE
$419,600
 6.5% ▼
TOTAL # CLOSED
117
 26.9% ▼
MEDIAN CLOSED SALE PRICE
$376,171
 4.8% ▼
MEDIAN CLOSED % OF ORIGINAL LISP
PRICE
92.3% ▲
 0.6% ▲
MEDIAN CLOSED DAYS ON MARKET
84
 1 ▼
 (Includes Previous Listing Period Data)
MONTHS OF
INVENTORY
MONTHS OF
INVENTORY %
CHANGE
6.2
34.8% ▲
Buyer's Market
Jim Boykin
214-869-3116
jimboykin@kw.com
NTREIS data for Single Family Detached Residences. Data is believed to be accurate but is not warranted. ©2025 ChartMaster Services, LLC. All rights reserved.
Page 6 of 6
Anna/Melissa, Fairview/Lucas/Parker & Van Alstyne
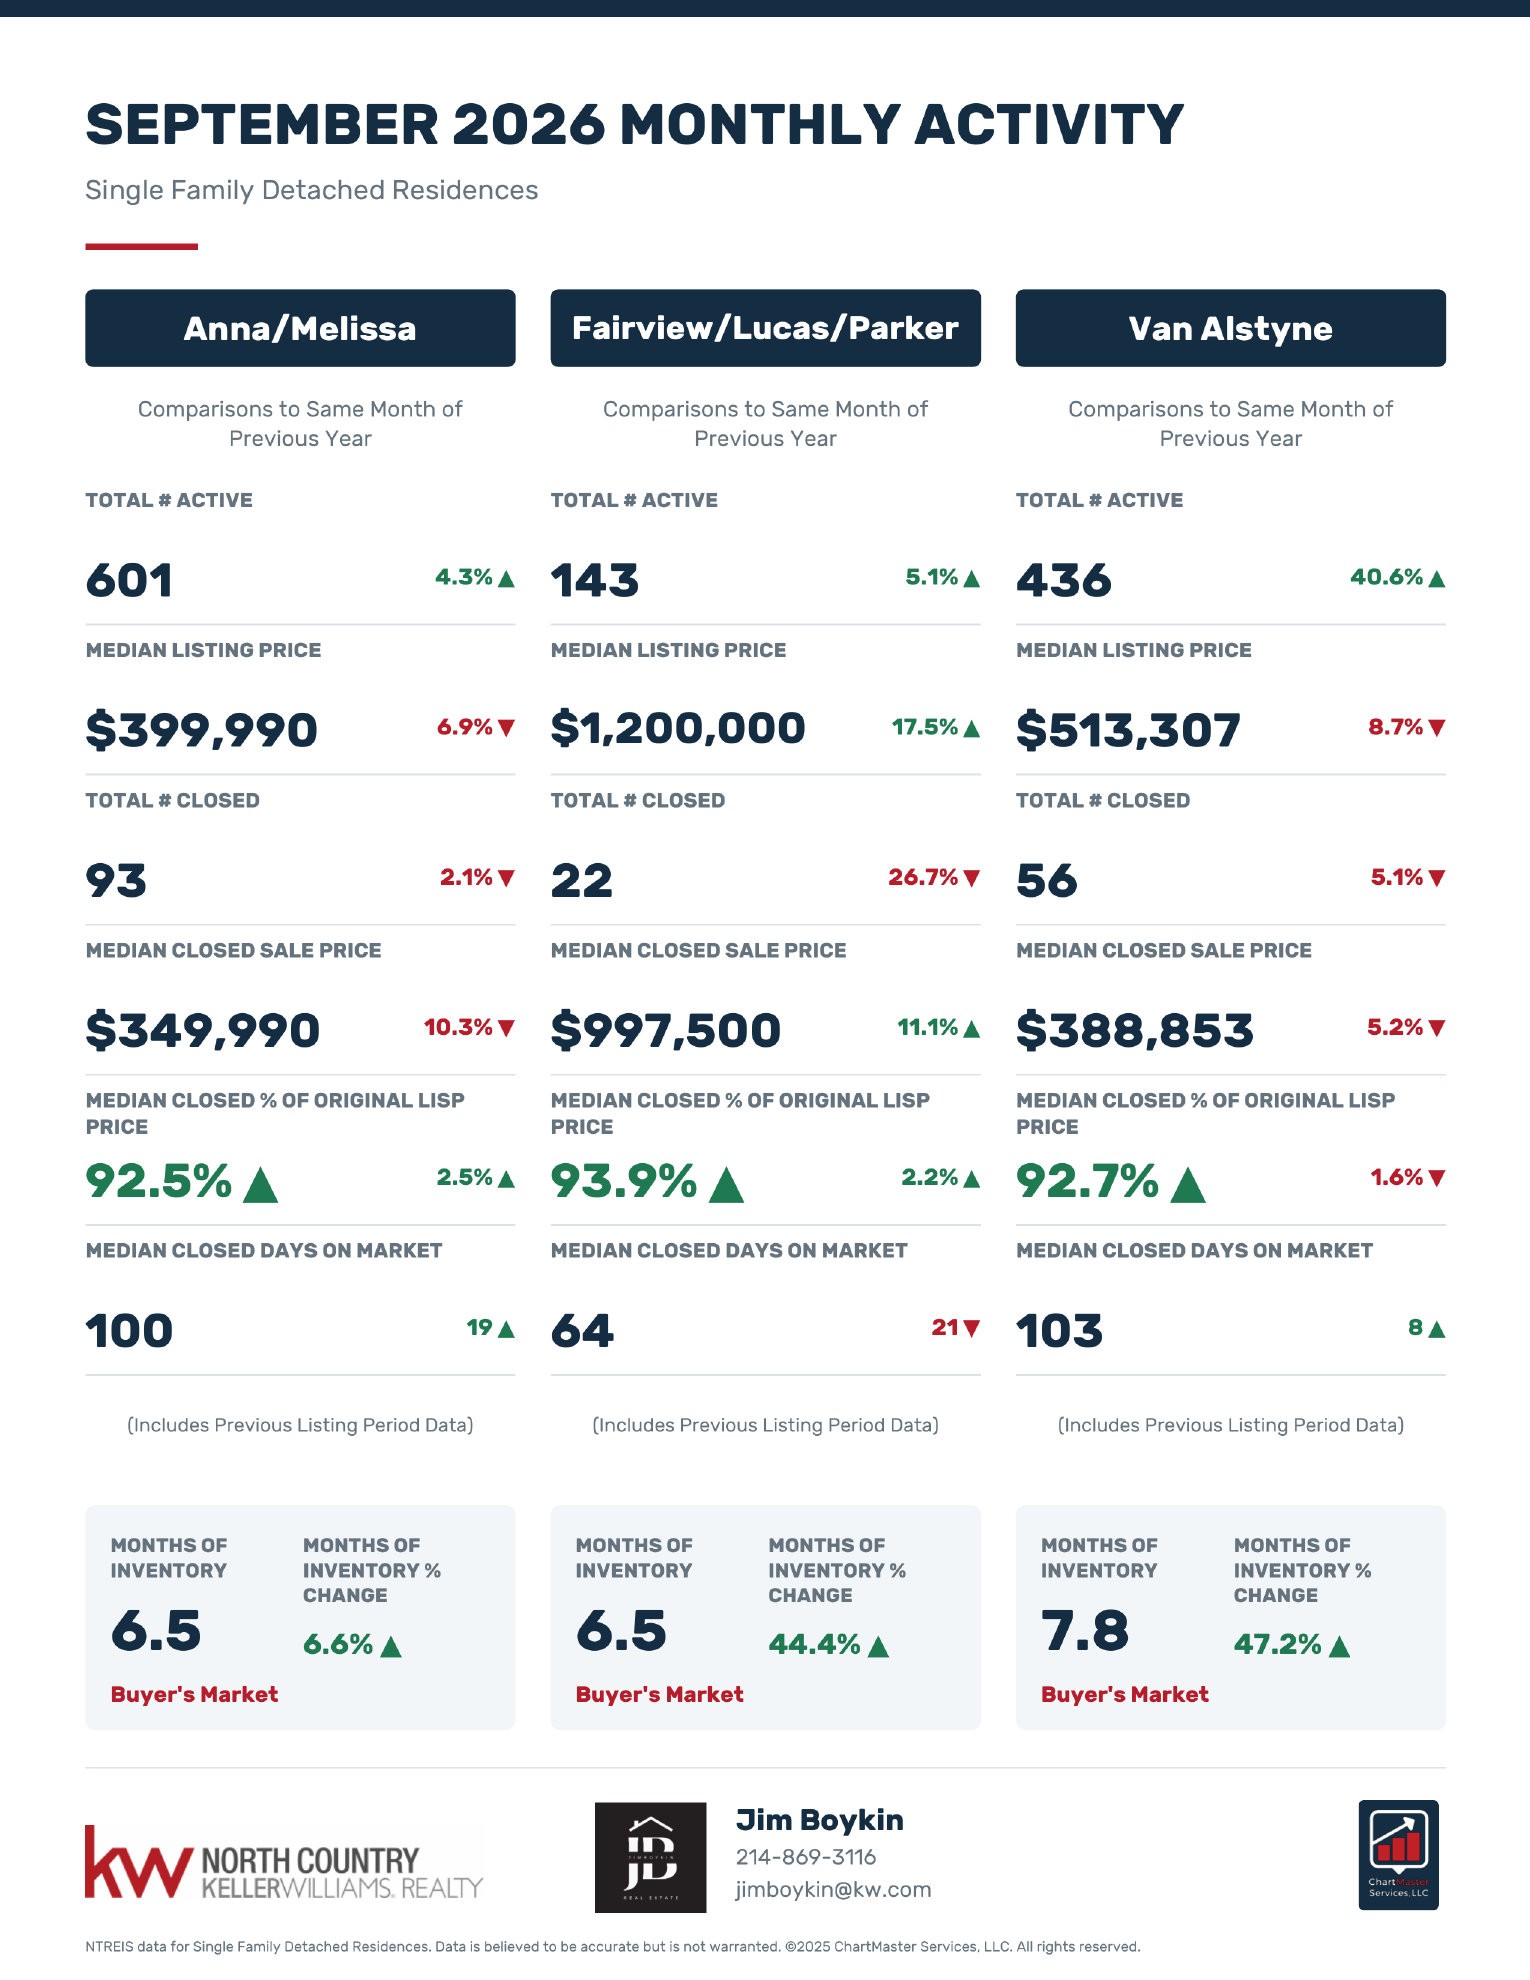
Text version of page 6
Text follows the original page’s reading order. For the chart columns and layout, use the page image or PDF.
SEPTEMBER 2026 MONTHLY ACTIVITY
Single Family Detached Residences
Anna/Melissa
 Comparisons to Same Month of
 Previous Year
TOTAL # ACTIVE
601
 4.3% ▲
MEDIAN LISTING PRICE
$399,990
 6.9% ▼
TOTAL # CLOSED
93
 2.1% ▼
MEDIAN CLOSED SALE PRICE
$349,990
 10.3% ▼
MEDIAN CLOSED % OF ORIGINAL LISP
PRICE
92.5% ▲
 2.5% ▲
MEDIAN CLOSED DAYS ON MARKET
100
 19 ▲
 (Includes Previous Listing Period Data)
MONTHS OF
INVENTORY
MONTHS OF
INVENTORY %
CHANGE
6.5
6.6% ▲
Buyer's Market
Fairview/Lucas/Parker
 Comparisons to Same Month of
 Previous Year
TOTAL # ACTIVE
143
 5.1% ▲
MEDIAN LISTING PRICE
$1,200,000
 17.5% ▲
TOTAL # CLOSED
22
 26.7% ▼
MEDIAN CLOSED SALE PRICE
$997,500
 11.1% ▲
MEDIAN CLOSED % OF ORIGINAL LISP
PRICE
93.9% ▲
 2.2% ▲
MEDIAN CLOSED DAYS ON MARKET
64
 21 ▼
 (Includes Previous Listing Period Data)
MONTHS OF
INVENTORY
MONTHS OF
INVENTORY %
CHANGE
6.5
44.4% ▲
Buyer's Market
Van Alstyne
 Comparisons to Same Month of
 Previous Year
TOTAL # ACTIVE
436
 40.6% ▲
MEDIAN LISTING PRICE
$513,307
 8.7% ▼
TOTAL # CLOSED
56
 5.1% ▼
MEDIAN CLOSED SALE PRICE
$388,853
 5.2% ▼
MEDIAN CLOSED % OF ORIGINAL LISP
PRICE
92.7% ▲
 1.6% ▼
MEDIAN CLOSED DAYS ON MARKET
103
 8 ▲
 (Includes Previous Listing Period Data)
MONTHS OF
INVENTORY
MONTHS OF
INVENTORY %
CHANGE
7.8
47.2% ▲
Buyer's Market
Jim Boykin
214-869-3116
jimboykin@kw.com
NTREIS data for Single Family Detached Residences. Data is believed to be accurate but is not warranted. ©2025 ChartMaster Services, LLC. All rights reserved.
A place to start
What does the market
mean for you?
The useful question is how today’s choices connect to the home you want to buy or sell. Bring your goals and your questions; we’ll focus the conversation.
Ask for a local market updateThree questions worth asking
Which homes are truly comparable?
Location, condition, layout, and the features of a particular home all provide context. Ask which properties are most useful to consider alongside yours.
What choices do buyers have?
Discuss the competing homes a buyer might be considering and what distinguishes each option. This keeps the conversation focused on a specific part of the market.
How does the timing fit my life?
A real estate decision also has a personal timeline. Be clear about your next step, the flexibility you have, and the questions you still need answered.